






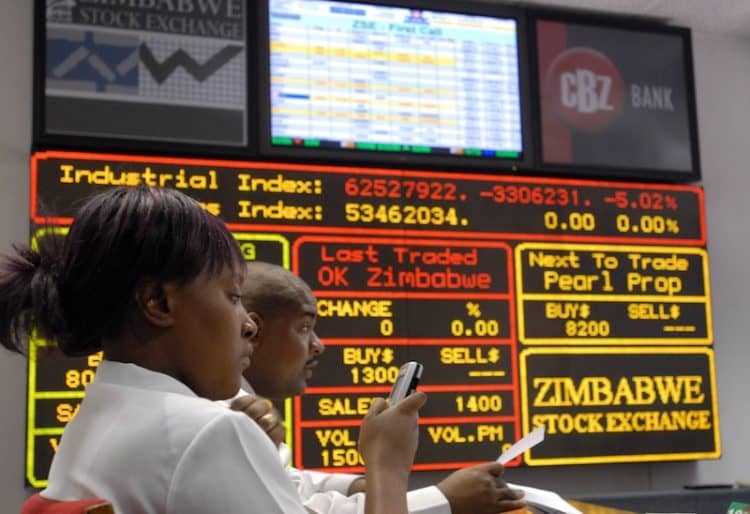
Zimbabwe’s headline stock market rally has been far narrower than the 63% surge in the Zimbabwe Stock Exchange All Share Index suggests, with the total value of listed shares rising by just 2.42% in ZiG terms since the end of 2025, according to a new market analysis by an analyst.
Sylvester Mupanduki’s Key Market Insights report shows that the All Share Index rose from 277.86 points at the end of December 2025 to 453.25 points on September 11, 2026, a 63.12% increase.
Over the same period, however, the ZSE equity board’s market capitalisation increased from ZiG97.10 billion to ZiG99.44 billion, a gain of only 2.42%.
In US-dollar terms, the picture is weaker still, with the value of the ZSE board falling marginally from US$3.74 billion to US$3.73 billion, a 0.17% decline.
Mupanduki argues that the divergence exposes a fundamental weakness in reading the index as a proxy for the performance of the entire market.
“A rally this narrow is a repricing of four stocks, not of a market.”
Four counters drove the headline gain. The analysis attributes most of the index’s annual increase to just four counters, with January and July accounting for about 80% of the index gain.
January contributed 78.18 points of the year’s 175.39-point increase, while July added another 63 points. The remaining seven months collectively contributed only 34 points.
Econet and Delta were responsible for about 90% of January’s price movement, with Econet rising 55.1% around its delisting from the ZSE and Delta gaining 40.2%.
The concentration became even more pronounced during the third quarter, when CBZ rose 45.45% and FBC gained 50%.
Together, the two banks added ZiG9.39 billion in market value, against a net increase of only ZiG5.16 billion for the board because Delta lost ZiG5.44 billion.
Importantly, neither CBZ nor FBC issued new shares during the period, meaning the gains reflected changes in their share prices rather than an expansion in the number of shares in issue.
Mupanduki said the wider market did not experience a comparable repricing.
“Four stocks account for the year; the other thirty-one rose 30 per cent in aggregate.”
The concentration is also visible in the structure of the exchange. By September 11, the top two counters accounted for 57.9% of the ZSE board, up from 47.6% at the end of December.
The index performance has also occurred alongside a significant change in the composition of the ZSE.
According to the report, five companies left the board, removing securities representing 21.59% of the December market value.
Related Stories
Because an index tracks the prices of its constituent shares rather than the total value of all companies that were listed at the start of the year, companies leaving the exchange can make headline index movements difficult to interpret alongside changes in overall market capitalisation.
Mupanduki said this is why the index needs to be considered alongside the composition of the market.
“The evidence suggests that the headline index performance, which tells only one part of the story, needs to be read alongside market composition, concentration and liquidity.”
The report also examines whether liquidity and monetary conditions helped amplify the share-price gains.
It notes that the minimum deposit rate remained at 7.5%, while the policy rate stood at 35% before being reduced to 30%.
ZiG deposits increased by 46.76% by June, while the Government paid contractors ZiG55.1 billion in ZiG from March and subsequently borrowed back ZiG6.8 billion from bondholders.
The analysis describes liquidity as a possible contributor rather than an established explanation for the market rally.
“Liquidity is a plausible amplifier, not a demonstrated cause.”
The report says deposits grew faster in the second quarter, increasing by 24.75%, compared with 17.65% in the first quarter, even as the index gained less in the second quarter than during the first.
The ZSE equity board was valued at about US$3.7 billion on September 11, compared with almost US$23 billion at the October 2018 peak.
That puts the ZSE alone about 83.8% below its 2018 peak in US-dollar terms.
However, the comparison requires adjustment because Zimbabwe’s capital-market structure has changed since 2018, with companies increasingly listing in US dollars on the Victoria Falls Stock Exchange.
The report puts VFEX’s contribution at approximately US$8.2 billion, taking the combined value of the two exchanges to about US$11.9 billion.
Even on that wider measure, the combined market remains about 48.1% below the 2018 peak, according to the report.
Mupanduki further adjusts for Old Mutual’s VFEX listing, noting that the company’s US$4.5 billion-plus market value was not part of the 2018 comparison.
On a like-for-like basis, excluding Old Mutual, the report puts the combined market at approximately US$7.9 billion, or 65.7% below the 2018 peak.
Recent market reporting has similarly pointed to concentrated trading activity. A September 13 market review said a major CBZ block transaction accounted for most of August’s sharp increase in ZSE turnover, while the number of trades actually fell.




Leave Comments