


By Jabulani ChibayaMBA
In a year shaped by macroeconomic volatility, geopolitical uncertainty and a renewed global commodities cycle, Caledonia Mining Corporation Plc delivered what stands out as one of the strongest gold mining performances in recent years.
FY2025 is not merely a story of higher earnings — it reflects operational resilience, disciplined capital management and long-term strategic positioning.
While the headline financial figures demonstrate rapid growth, the deeper narrative lies in how the company converted favourable gold prices into sustainable financial strength while preparing for expansion beyond a single-asset model.
The Headline Numbers — A Year of Financial Acceleration
The company’s 2025 financial performance shows step-change growth rather than incremental improvement:
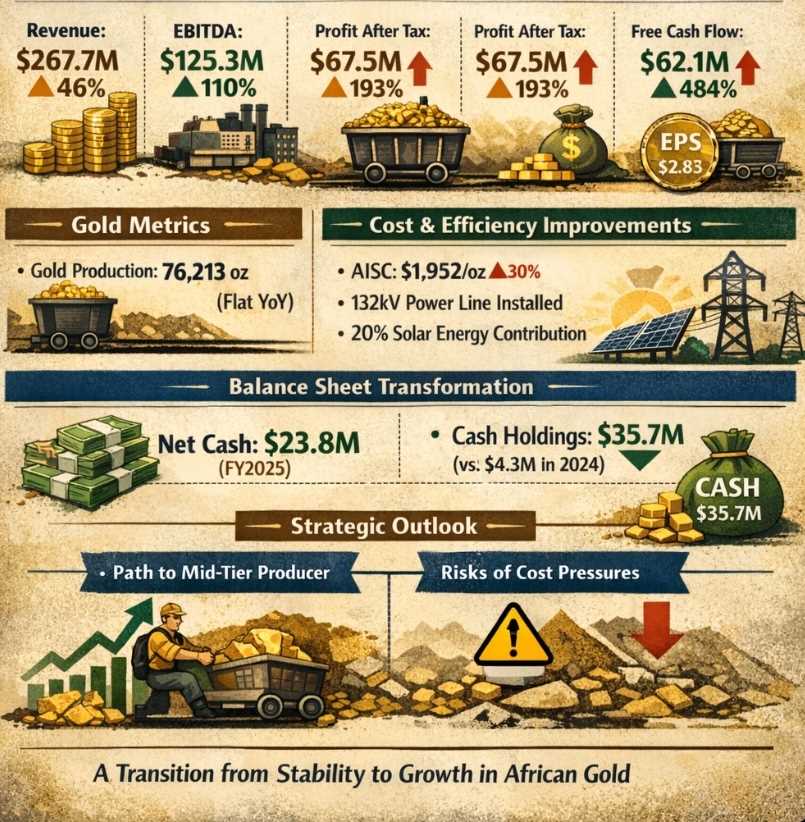
Revenue: US$267.7 million (↑ 46% YoY)
EBITDA: US$125.3 million (↑ 110% YoY)
Profit After Tax: US$67.5 million (↑ 193% YoY)
Free Cash Flow: US$62.1 million (↑ 484% YoY)
EPS: US$2.83 (↑ 211% YoY)
Operating Cash Flow: US$76.2 million (↑ 82% YoY)
These gains were driven by a combination of favourable commodity pricing and internal operational execution. The results signal acceleration rather than recovery, positioning the miner within a stronger earnings cycle.
EBITDA Explosion — What It Really Means
The doubling of EBITDA to US$125.3 million represents the clearest indicator of value creation during the year.
The EBITDA expansion reflects:
Strong operating leverage
Higher margin per ounce
Effective cost containment despite inflationary pressures
This performance came despite rising costs:
AISC increased to US$1,952/oz
On-mine costs rose 17.7%
Margins widened primarily because the realised gold price surged to US$3,383/oz, representing a 44% increase year-on-year.
The result was an approximate US$1,400 per ounce margin spread, placing operations within a highly profitable band for gold mining.
Insight: FY2025 represents a classic price-led earnings expansion cycle, amplified by operational consistency and disciplined execution.
Production & Operational Reality — Stability Over Growth
Gold Production: 76,213 oz (flat YoY)
Gold Sales: 79,075 oz (↑ 1.5%)
At face value, flat production may appear underwhelming. Strategically, however, stability proved advantageous.
Why Flat Production is a Strength:
Preserves predictable cash flows
Demonstrates maturity and reliability of the Blanket Mine asset
Allows capital to be redirected toward future growth projects
Operational pressures nevertheless emerged:
Grade decline from 3.2 g/t to 3.07 g/t
Power disruptions affecting output
Transition into new mining zones
Insight: The company is moving from single-asset stability toward multi-asset expansion — a transitional phase typical of scaling mining companies.
Cost Structure — Inflation vs Engineering Control
Costs increased during the year:
Production costs rose to US$101.3 million (↑ 25%)
Related Stories
AISC climbed to US$1,952/oz (↑ 30%)
Key drivers included:
Labour inflation
Higher electricity costs
Expanded underground development work
Management responses focused on structural cost engineering rather than short-term containment:
Development of a 132kV power line to reduce energy costs
Solar integration now contributing roughly 20% of the energy mix
Shaft efficiency upgrades aimed at long-term productivity gains
Insight: The company is shifting from absorbing inflationary pressures to actively redesigning its cost base.
Cash Flow & Balance Sheet — The Silent Transformation
Perhaps the most significant development of FY2025 was the transformation of the balance sheet.
Cash holdings increased to US$35.7 million, up sharply from US$4.3 million previously.
Financial positioning shifted dramatically:
FY2024: Net Debt — US$8.7 million
FY2025: Net Cash — US$23.8 million
This represents a financial swing exceeding US$32 million, fundamentally changing the company’s capital profile.
Liquidity Stack:
Total liquidity: approximately US$55 million
US$130 million convertible notes due in 2026
Potential US$150 million project financing capacity
Insight: Caledonia has transitioned into a self-funded growth company, reducing reliance on expensive or distressed capital markets.
Cash Flow & Balance Sheet — The Silent Transformation
One of the most powerful developments remains the strengthening liquidity position:
Cash: US$35.7M (vs US$4.3M)
Net position shift:
FY2024 — Net Debt US$8.7M
FY2025 — Net Cash US$23.8M
The improved balance sheet provides financial flexibility at a time when many miners globally remain constrained by capital costs.
Liquidity stack:
Total liquidity near US$55M
US$130M convertible notes (2026)
Potential US$150M project financing
Insight: The company now operates from a position of financial strength, enabling growth funded internally rather than through crisis financing.
Final Investment View — Where Does This Lead?
Caledonia Mining Corporation Plc stands at a strategic inflection point.
If execution succeeds, the company could evolve into a mid-tier African gold producer.
Earnings could scale non-linearly
Market valuation may rerate significantly
If execution falters:
Capital expenditure pressures combined with cost inflation could compress returns.
In an environment where global uncertainty continues to drive investors toward gold, Caledonia is positioning itself as a leveraged proxy to both rising gold prices and future production growth.


Leave Comments